Effect of the environment in a precision 5-axis machine tool

The fluctuations of the air temperature have a direct impact on the thermal errors of the machine tool. In manufacturing workshops, sudden changes of the air temperature appear associated with opening the doors of the machine tool hall or turning on and off the air conditioning system.

In this project, we focused on evaluating the design of a 5-axis machine tool to test its sensitivity to changes of the environmental temperature. We developed a thermo-mechanical model of the machine tool assembly, considering the internal cooling systems.

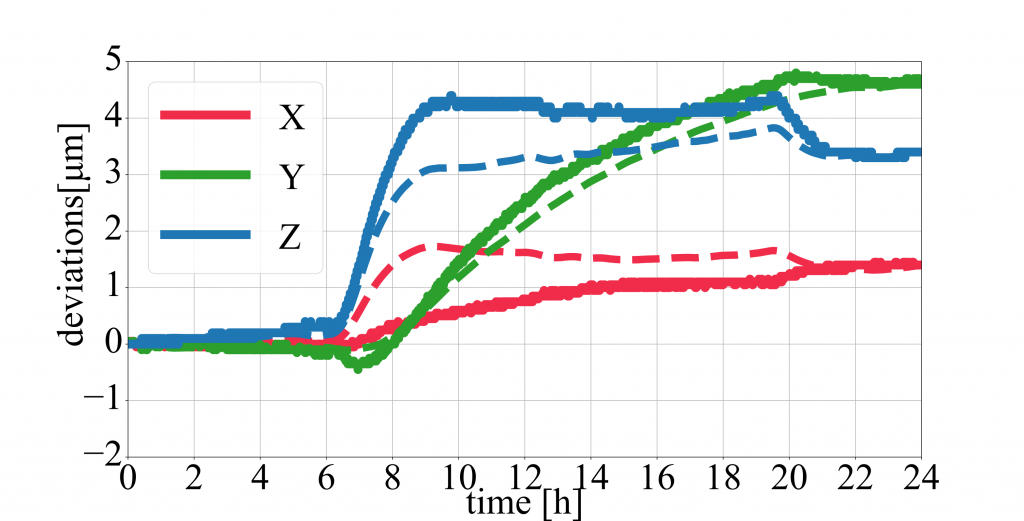
In order to validate the thermo-mechanical model, we measured the thermal errors between a mandrel located in the spindle and a set of capacities sensors attached to the table. We modified the measurement setup of the ISO 230-3 in order to account for the radial expansion of the mandrel. Including two sensors in each direction, we were able to separate linear movements from radial expansions, using the reversal method.
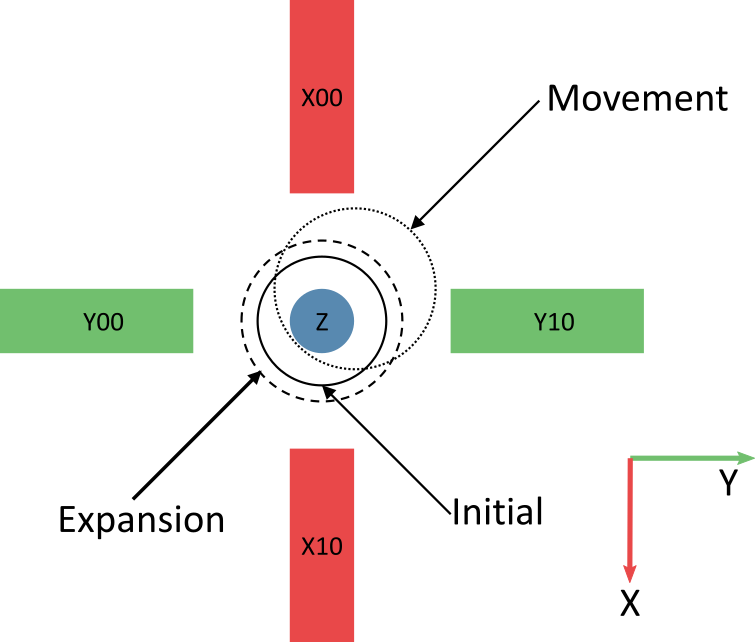
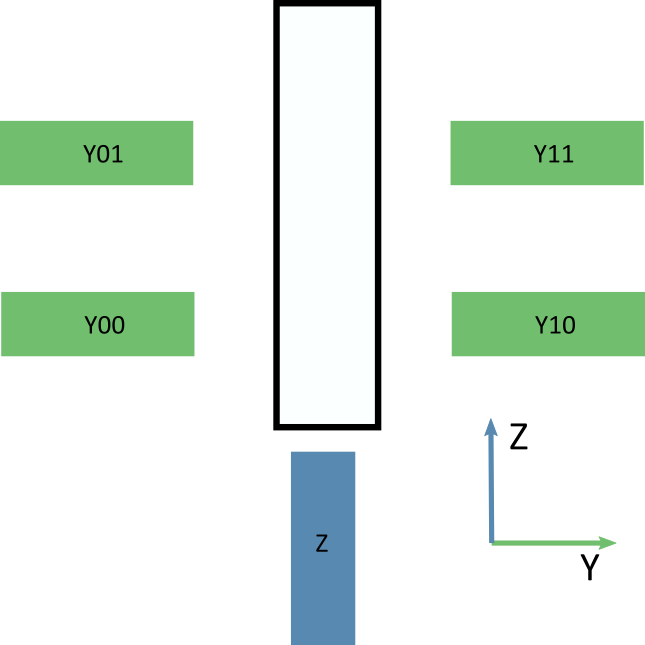
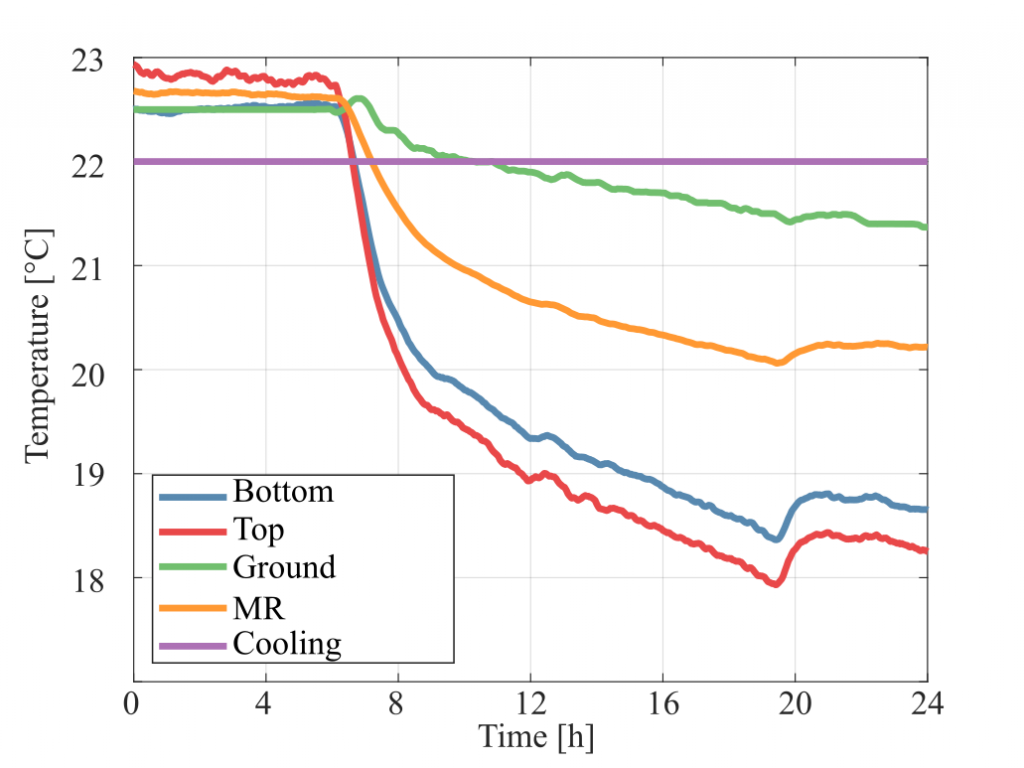
The load case under consideration is an environmental temperature drop over 24 h. We measured the air temperature at 4 different locations in order to account for the spatial variability of the room temperature.

We compared the measured (full line)  and simulated (dashed line) thermal errors associated to the drop of the air temperature.

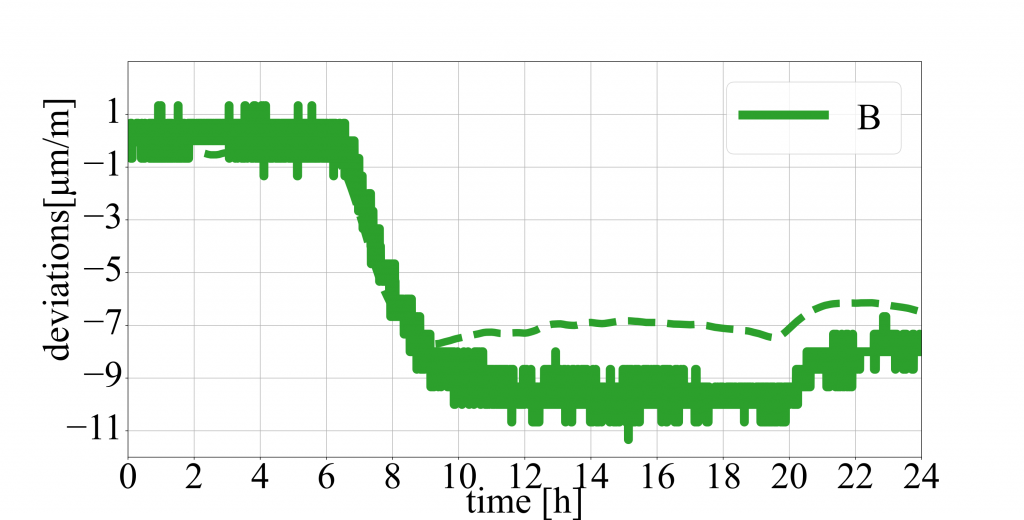
Furthermore, we investigated the angular errors in B-direction and compared the measurement (full line) and model (dashed line) results.

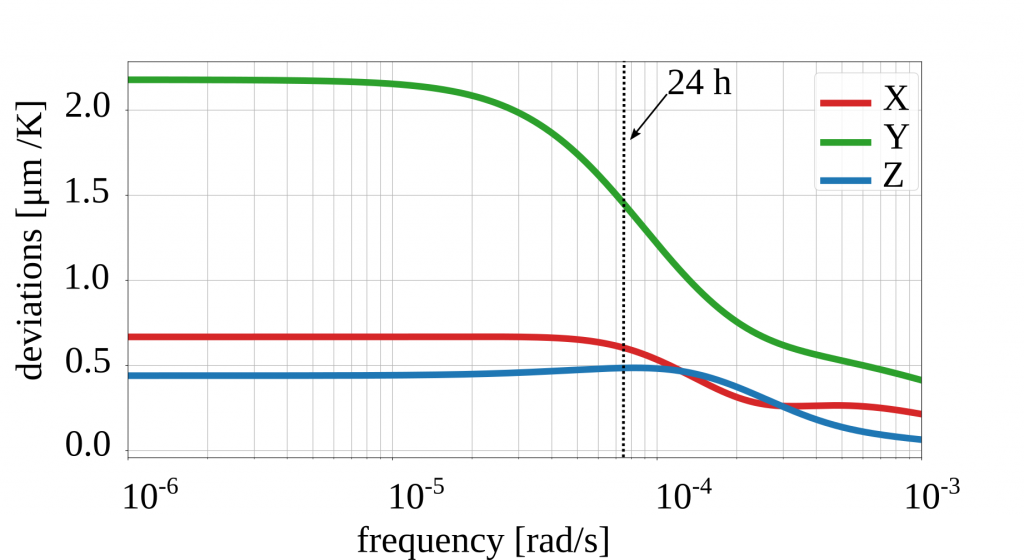
We used the validated model to determine the response of the system in frequency domain. The frequency response function (FRF) shows the thermo-mechanical displacements associated to fluctuation of environmental temperatures in the frequency range of interest. These methods enable us to determine the amplitude of the displacements for characteristic frequencies, such as the frequency associated with the 24 h periodicity (day-night cycle).

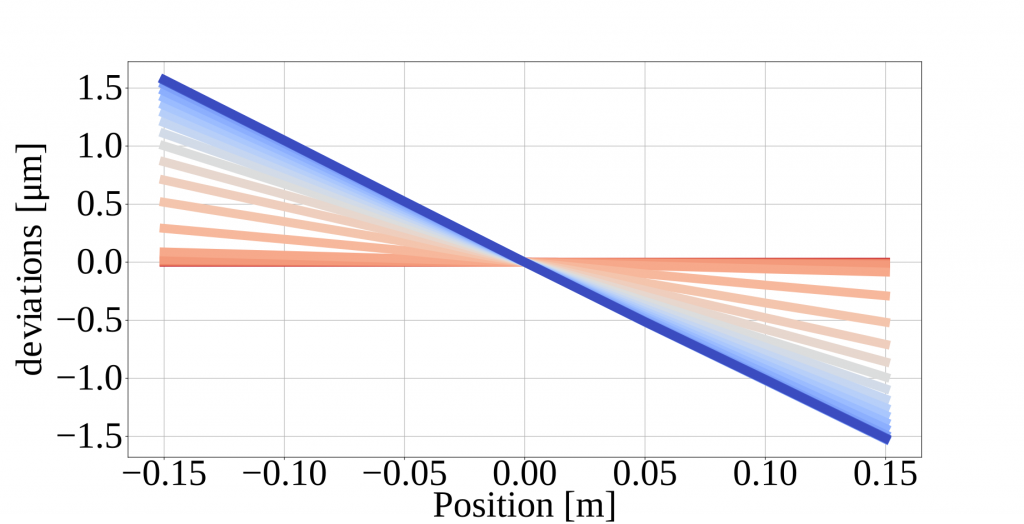
Furthermore, the thermo-mechanical model provided information about the thermal errors at different positions of the linear axes. The figure below shows the variation of the positioning error of the Z-axis over the whole stroke of the linear axes.